
Microsoft Power BI is a tool designed to transform numbers into simple pictures which helps to understand data. Instead of reading long tables, you see charts, graphs and clear visuals. This makes data easier to understand and easier to explain.
Data is everywhere now; we get it from phones, work even from schools. Because of this, knowing how to read and understand data has become very important. Understanding it helps make good choices as well as fast choices, an essential skill in this busy world.
People around the world use Microsoft Power BI to study better, work smarter and plan more clearly. This blog explains what Power BI is, why learning it matters today and how anyone can start learning it step by step.
Starting Your Power BI Learning Journey
Many beginners feel worried when they hear the word “data”. They think it sounds difficult or technical. The good news is that learning Power BI does not need a technical background.
You do not have to be good at math or programming. Learning Power BI in a way similar to learning a new language. The key is to go slow while practicing a bit each day. Gradually, things will start to make sense.
Learning must be done step by step as each step is a continuation of the previous step. That is how confidence grows.
The 6 Steps to Learn Power BI
Learning Microsoft Power BI does not happen at once. It happens step by step simultaneously building confidence and clarity.
If you go through these steps in order, learning Power BI will become easier.
Step 1: Get to Know the Power BI Interface
Before doing anything else, you need to understand the interface of the tool.
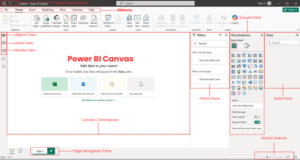
When you open Power BI for the first time, you see buttons, panels and empty spaces. This can feel confusing at first, which is normal. The goal is simple- to explore and feel familiar with the screen. See the ribbon at the top with tabs like Home, View and Insert. The left side has icons for Report, Table/ data and Model views. The middle is your workspace while the right side shows panels for visuals and fields.
Once the interface feels less scary, learning becomes smoother.
Step 2: Learn Where Data Comes From
Power BI works with data. So, the next step is understanding where data comes from.
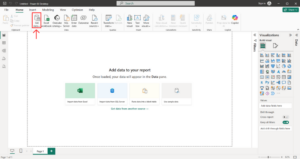
Data can come from simple files like Excel. It can also come from folders or online systems. In this step, learners focus on connecting data, not changing it. You are only telling Power BI, “This is my data.” This helps you understand how Power BI reads information. On the home screen, click on “Get data” from the Home ribbon.
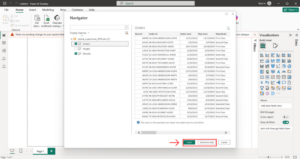
Choose you file from the dialog box and click “open”. Select the tables you need from the Navigator window then you can click on load to import data or Transform data for cleaning.
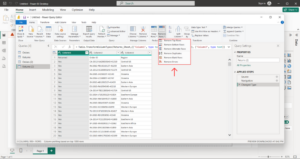
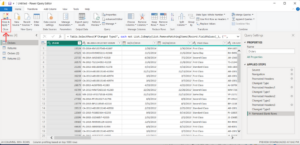
Step 3: Clean and Prepare Your Data
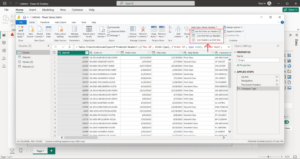
Before data can be used, it needs to be cleaned. This simply means fixing small problems in the data. Sometimes data has empty spaces, numbers are repeated, or dates are written in different formats. Power Query Editor is used for this. Click Transform Data, make the desired changes such as removing extra rows of splitting columns and apply the changes when you are done.
Cleaning makes data neat. It ensures that your pictures show true stories. Simple clicks do most work, providing you better results.
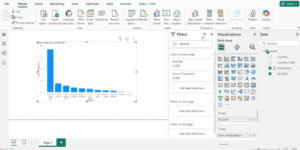
Step 4: Create Simple Visualizations
Once the data is ready you can use it to turn it into visuals. This is where Power BI becomes easy to understand.
Go to Report view to make pictures. Drag fields from the right panel to the canvas, pick your desired chart type which is automatically built by Power BI.
Visuals turn numbers into easy views. A bar chart shows top items fast. Start with basics. This step is fun and shows quick wins that keep you going.
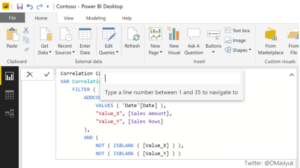
Step 5: Learn Basic DAX Formulas
DAX (Data Analysis Expressions) sounds complex, but it is not. DAX formulas are simple rules that help calculate values.
For example, you might want to:
- Count total items
- Add numbers together
- Compare one value with another
Power BI provides help while writing formulas. You do not need to remember everything.
DAX adds smart math; it can find averages or differences. Start with easy ones, try examples first. This step boosts your reports and becomes more useful for real questions.
Step 6: Build Full Reports and Dashboards
Once you are comfortable with DAX, start applying it by building simple Power BI reports. Working with real datasets helps strengthen your skills and shows how you can answer business questions using data. You can begin with free datasets and gradually build your own Power BI project.
In this step, everything comes together. Place visuals on your report page neatly. Create a dashboard view with key charts, ready to share or publish.
Follow these steps slowly and leverage online tutorials for extra help. Soon, you will master Power BI confidently.
Benefits of learning Microsoft Power BI
Clear and Easy to Understand Visuals
Microsoft Power BI changes numbers into a visual that makes sense at a glance. Charts and graphs enable people to spot patterns and change quickly. This makes data easier to understand, even for beginners. It also helps explain information clearly to others.
Faster Access to Useful Information
Power BI reduces the time spent on manual reports. Data updates automatically, so information is always current. This saves effort and helps people focus more on decisions instead of preparing data.
More Confidence in Data and Decisions
Power BI keeps information consistent across reports. Everyone sees the same numbers and visuals. It gives credibility to the data and helps in having more confident discussions.
How Long Does It Take to Learn Power BI?
This depends on the amount of time you are able to spend practicing. Basic understanding will take only a few weeks. Comfort with real tasks may take a few months.
Practice 1-2 hours a day. In a month you will be able to make simple charts, in 2-3 months, you will be able to build full reports. Microsoft offers a 30-day challenge to skill up. This sets a good pace. Keep track of your growth and eventually you will feel confident using the tool on your own.
You don’t need to master everything at one time. Step-by-step learning is enough to get started.
Best Resources to Learn Power BI
Learning Microsoft Power BI will become much easier if you pick the right learning resources. Always remember to take your time. The goal is not to rush. The goal is to understand slowly and clearly. Good learning resources explain ideas step by step. They also show how Power BI is used in real situations and not just in theory.
Webinars
Power BI webinars are a helpful starting point, especially for beginners. They are usually short, focused and easy to follow. In a regular Power BI webinar, a learner is introduced to the basics first. This often includes introduction to Power BI, why it is used and how data would make sense with the use of visuals. Many webinars also show simple examples like how to turn a file into a graph or even how to create a basic dashboard.
Webinars are useful because they show how things work in real time. You can see the tool in action. You can understand how people think while working with data.
They are also flexible. You can attend them live or watch recordings later. This makes webinars a good option for students, working professionals and teams.
Structured Courses
While webinars give an overview, courses help you build strong skills. They follow a clear path starting with basics and then progressing towards real-world use.
A structured Power BI course helps learners understand not just what to do, but why they are doing it. It focuses on data preparation, visuals and reporting in a guided way.
Two structured courses that support this learning journey are:
These courses are useful for both beginners as well as learners interested in deeper knowledge. They help build confidence gradually by using real examples with clear explanations.
Is Power BI Hard to Learn?
Many beginners ask this question. The honest answer is no. Power BI is designed for beginners. You do not need to be technical or advanced math skills.
What usually feels difficult at first is not the tool itself. It is understanding data. Once data starts to make sense, Power BI becomes much easier to use. Power BI uses visuals instead of complex steps. You see results quickly, which keeps learning motivating. Small progress builds confidence over time.
Why Power BI Skills Matter Globally
Power BI skills hold value worldwide. Data shapes decisions everywhere from personal plans to global teams. Therefore, understanding data is a basic skill and no longer an option.
It is here that Microsoft Power BI can make a difference. It assists people understand patterns, explain ideas clearly, and make better decisions using facts instead of guesses.
Structured, Microsoft-aligned learning help close the gap between having data and understanding it. It supports students preparing for the future, professionals in doing better work and institutions planning with clarity.
Power BI skills are useful anywhere in the world. They travel across roles, industries and countries.